Your AI visibility score swings overnight. Here are the 3 numbers worth reporting.
Your score swings because each AI answer is generated fresh, not retrieved from a fixed table. Ask the same buyer question twice and the engine can name different brands, in a different order, citing different sources, minutes apart. The score is real. It is just one draw from a moving distribution.
Your AI visibility score swings because AI answers are non-deterministic. The same prompt returns a different answer, and a different score, from one run to the next. A single reading is one sample, not the truth. Report three numbers instead. Citation-frequency trend, share of voice averaged over many runs, and cross-model consistency. As of June 2026, these are the three that survive scrutiny in a board meeting.
This is not a glitch in a tool. In a 2026 experiment widely reported by Search Engine Land, Rand Fishkin's team ran nearly 3,000 identical queries through AI models and found the chance of getting the same ordered list of brands twice was under 1 in 1,000 (Search Engine Land, 2026). Separately, 40% to 60% of the sources AI engines cite change from one month to the next (Search Engine Land, 2026). The number moves because the ground underneath it moves.
So the question every marketer is asking in the AEO forums right now is the right one. How do you actually measure this when every tool, and every run, gives you a different number? Here is the answer, and the three numbers to take to your boss.
Why does your AI visibility score swing overnight?
Your score swings because each AI answer is generated fresh, not retrieved from a fixed table. Ask the same buyer question twice and the engine can name different brands, in a different order, citing different sources, minutes apart. The score is real. It is just one draw from a moving distribution.
In one example that circulated widely in the AEO community this year, a single prompt's share of voice for a brand read 25% in the morning, climbed to 63% by midday, and settled at 43% by evening. Same engine. Same question. Same day. Nothing about the brand changed. The measurement changed, because the thing being measured is a probability, not a fact.
This is why two tools hand you two different numbers, and why your own dashboard looks healthy one week and alarming the next. Neither number is wrong. Both are single samples, and a single sample of a non-deterministic system tells you almost nothing on its own.
Cleotic is an AI brand visibility tracker built for this exact problem. Cleotic runs your prompts repeatedly across the major AI engines on a fixed weekly schedule, so you read the pattern rather than the noise.
See your three numbers across the major AI engines. Run a free Cleotic.AI brand audit.
How many times do you need to run a prompt before the number means anything?
You need to run each prompt many times, on a fixed schedule, and report the average. One run is noise. Run the same prompt enough times and the average settles into a number you can trust and defend.
Picture flipping a coin three times and getting two heads. You would not report that the coin lands heads 67% of the time. You would flip it a few hundred times first. An AI visibility score from a single run is that three-flip number. It feels precise and it means very little.
Research on measuring AI search in 2026 points the same way. Treat visibility as a distribution, not a single figure, and run a fixed panel of buyer-intent prompts on a regular schedule. A panel of 100 or more prompts, run weekly, is a sensible floor. Below that, the wobble drowns out the signal.
This is the core of how Cleotic works. Cleotic runs your prompt set across the major AI engines every week, records every brand named in every answer, and reports the average and the trend with the verbatim answers behind them. You see the settled number, not a lucky or unlucky single roll.
Which 3 numbers should you actually report?
Report citation-frequency trend, averaged share of voice, and cross-model consistency. Together they answer the only three questions a leadership team actually has. Are we showing up more or less, are we beating our rivals, and can we rely on it.
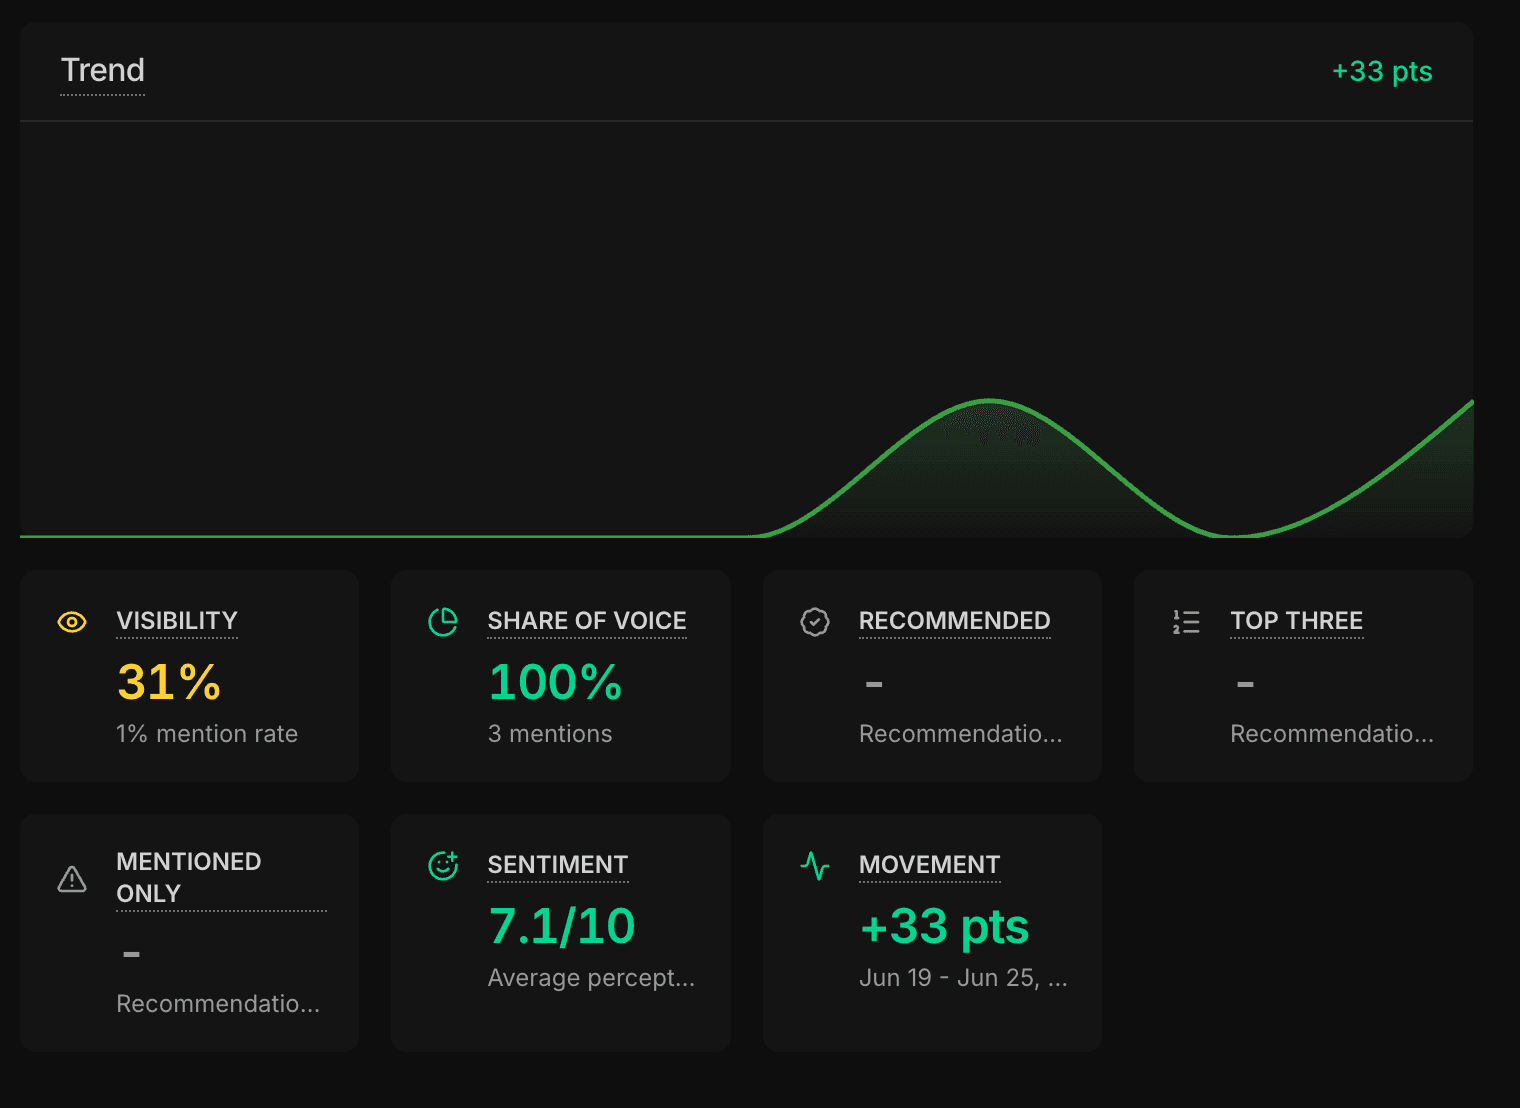
1. Citation-frequency trend. This is how often your brand appears across your prompt panel, plotted over weeks. The direction matters far more than any single week's figure. A line moving up means your visibility work is landing. One reading in isolation means nothing, because it could be the morning 25% or the midday 63%. The trend cancels the wobble.
2. Share of voice, averaged over many runs. This is your mentions as a percentage of all brand mentions for the same questions, measured against your named competitors, then averaged across every run in the period. The averaging is the point. It turns a jumpy daily figure into a stable read on whether you are gaining or losing ground against the brands a buyer is choosing between.
3. Cross-model consistency. This is whether the major engines agree about you. If ChatGPT, Perplexity, Gemini, and Claude all name you for a question, your presence is durable. If only one does, you are one source change away from disappearing. Consistency tells your boss how solid the visibility is, not just how high.
Three numbers. Each one a trend or an average with a range around it, never a single point. That is a report a finance-minded leader will trust, because it behaves like every other metric they already rely on.
How is this different from the dashboard you already have?
Most tools show a single score from a single run. That is the number that swings, and it is why your reporting feels shaky. The fix is not a prettier dashboard. It is a sounder method.
What you see | A typical single-score tool | The three numbers in Cleotic |
The headline figure | One score from one run | A trend and an average with a range |
Day-to-day swing | Shown as real change | Averaged out, so signal survives |
Competitors | Often hidden | Share of voice against named rivals |
Reliability of the score | Unstated | Cross-model consistency, stated plainly |
What you can tell your boss | The number went up or down | Whether you are genuinely winning |
The difference is trust. A score that swings 38 points overnight cannot be reported. A trend, an average, and a consistency read can be reported every month with a straight face.
Where to start
Measuring AI visibility properly is a method, not a guess. Start with these four steps.
Pick 20 to 30 buyer-intent prompts, written in the words your buyers actually use.
Run each one many times across the major AI engines, on the same schedule every week.
Report three numbers only. Citation-frequency trend, averaged share of voice, and cross-model consistency.
Ignore any single reading. Watch the direction over weeks, and brief your boss on the trend.
Your AI visibility score will keep swinging, because the engines behind it are built to. That is not a reason to distrust the measurement. It is a reason to measure it properly and report the pattern, not the roll of the dice.
You do not have to assemble this by hand. Cleotic tracks your three numbers across the major AI engines, runs your prompts on a weekly schedule, and shows you the trend with the verbatim answers behind it. Run a free Cleotic.AI brand audit to see where you stand today, or start a free 14-day trial and watch the numbers settle week to week.