Overview
On this page
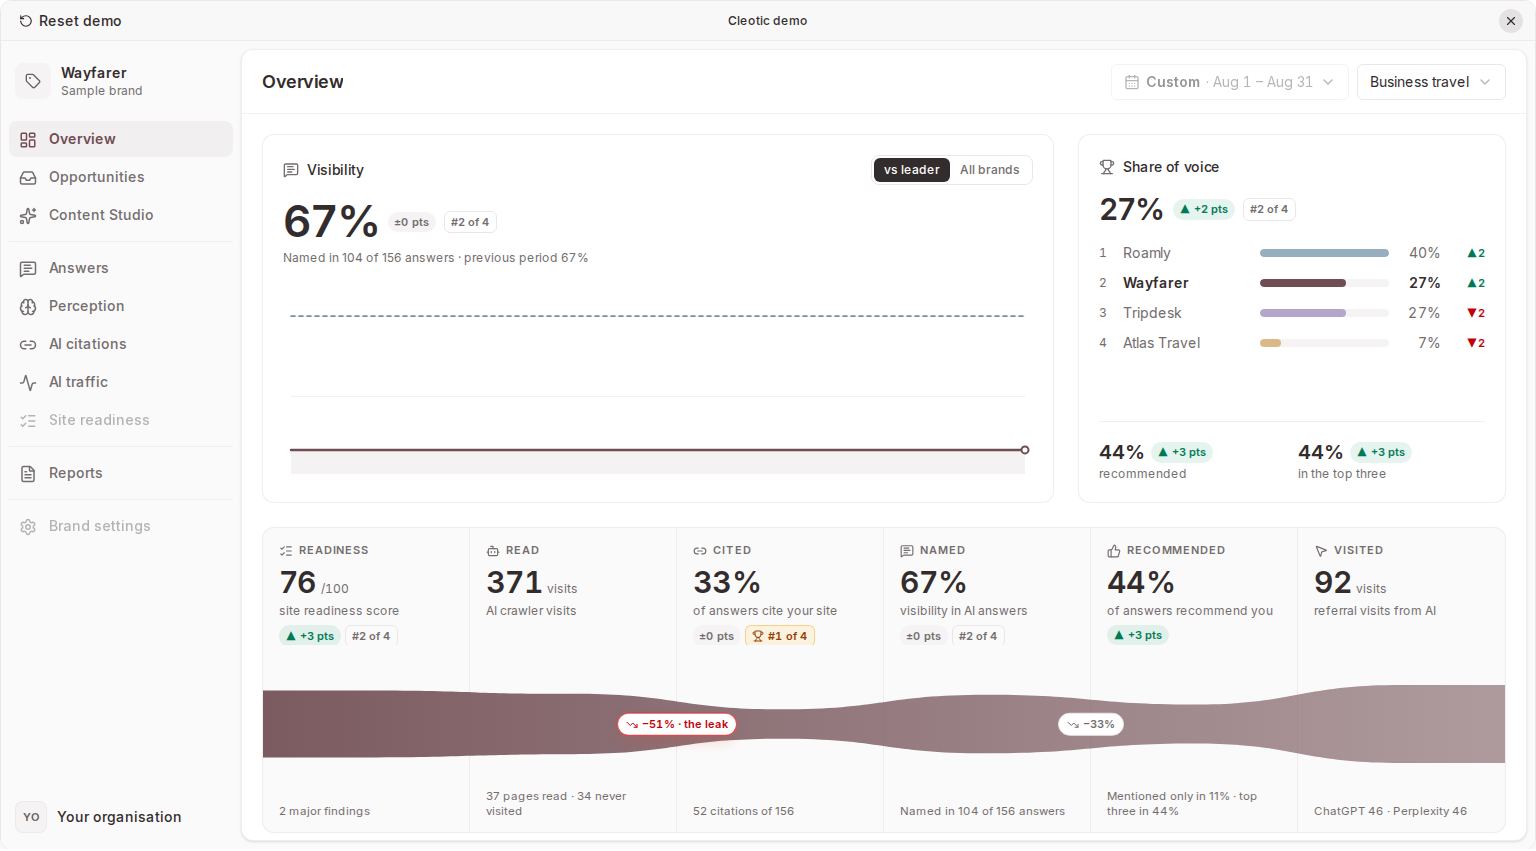
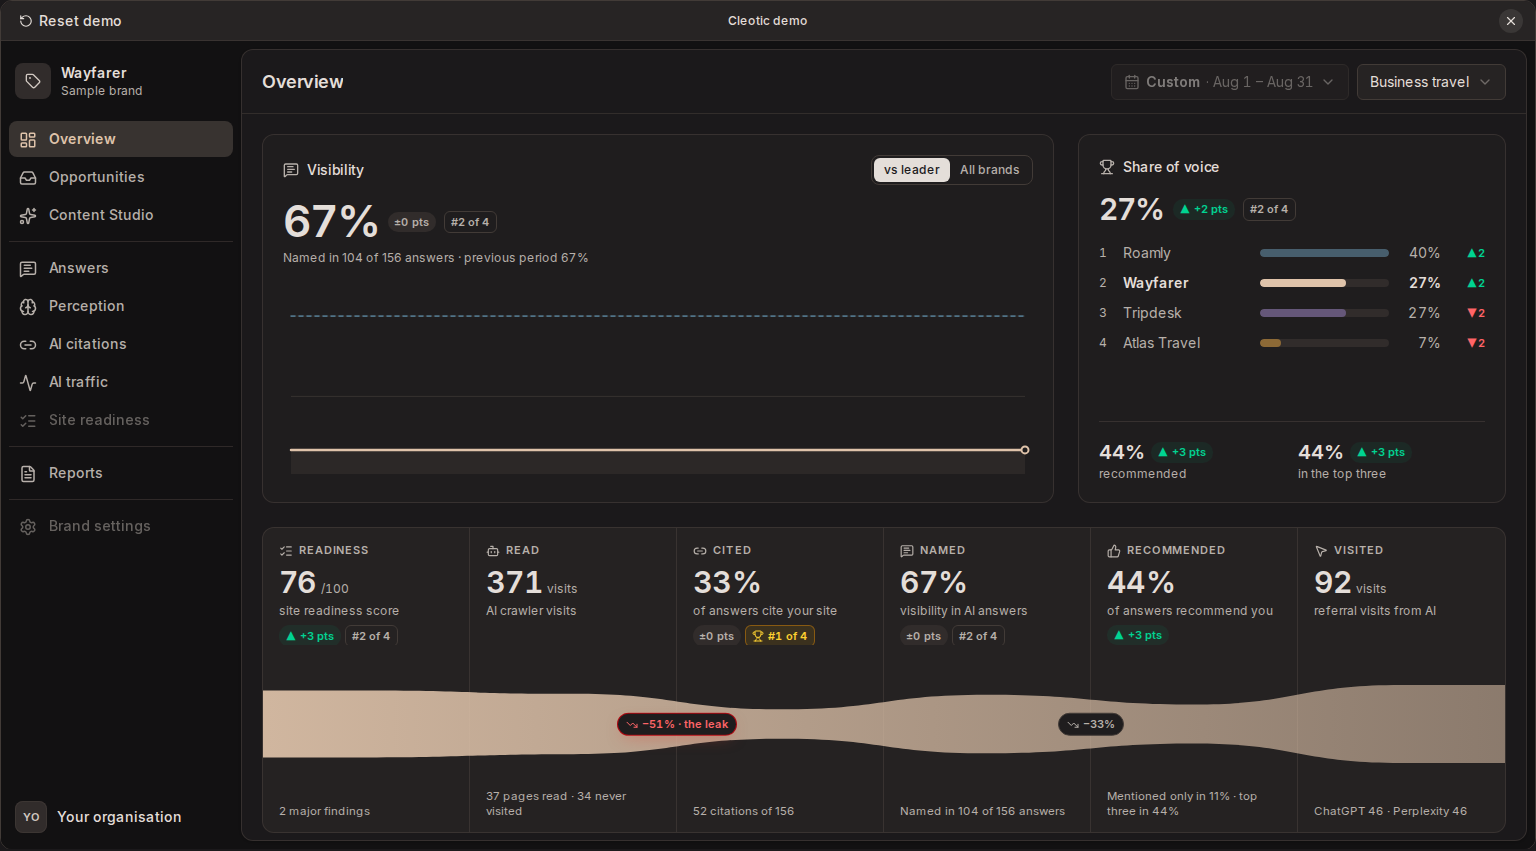
Overview is the brand's first page. It shows how the brand is doing across Cleotic, from its website to the visits AI sends, and opens each part in its own page.
Set the scope
Choose Week, Month or Year, or a custom range, then select a segment or leave All segments selected. Each figure's change compares the chosen period with the one before it. Segments narrow the answer figures; site readiness and AI traffic always cover the whole site.
Read the figures
AI answers vary from run to run, so each answer figure is an estimate. Cleotic shows the range it likely sits in, for example Likely 28–41%, and treats a move as a change only when it is larger than that variation could explain:
- An up or down arrow means a real change on the previous period.
- No real change on visibility or share of voice means the move is within normal variation. Elsewhere, such a move shows no arrow.
- Brands within normal variation of each other share a place, for example Level with Acme for #1.
- A figure resting on fewer than 10 answers is Calibrating. It is shown with a note, because it can still move a lot as answers arrive.
See the likely range for how ranges are worked out.
Visibility and share of voice
The top of the page shows visibility and share of voice, each with its likely range and the brand's place among the brands you track. Visibility is the share of answers that name the brand, out of the answers across your questions. Use All brands to put every competitor on the visibility chart. For periods of three weeks or more, the chart shows a weekly line with the likely range shaded around it, across the previous period and this one. Recommended and top-three rates sit under share of voice, each with its likely range.
The pipeline
The pipeline follows the brand through six stages:
| Stage | What it measures | Page |
|---|---|---|
| Readable | The site readiness score from the latest scan | Site readiness |
| Read | Visits from AI crawlers | AI traffic |
| Cited | The share of answers that cite the brand's own site | AI citations |
| Named | Visibility in AI answers | Answers |
| Recommended | The share of analysed answers that recommend the brand | Answers |
| Visited | Referral visits from AI engines | AI traffic |
The ribbon narrows where the brand loses the most between one stage and the next. The largest loss is marked as the leak. Stages that are not set up, such as AI traffic before site tracking is connected, are hatched and link to the step that switches them on.
Select a stage to jump to its row. Each row shows the stage's figure, its change and place, a chart for the period and the breakdown behind it, and links to its page with the same period and segment. Visibility by engine draws each engine's likely range as an outline around its bar.
Finish setting up
Until everything is connected, a strip under the pipeline lists what is left: prompts, competitors, the website, a site scan, site tracking, a CMS and a shared report. It disappears once they are all done.
The work
The last section shows the work that moves these numbers: open opportunities by stage, Content Studio pages and how often answers cite them, and your latest report.
Investigate a change
Keep the segment, prompts, models and competitors consistent when comparing periods. A period with no answers shows no change rather than a jump from zero. A real change says the numbers moved, not why: check recent response coverage and setup changes before crediting movement to content work.
Related
Updated